
- Press the green “Sel” button on the ringing microphone.
- Tap the “PEQ” tab at the top of the main touchscreen.
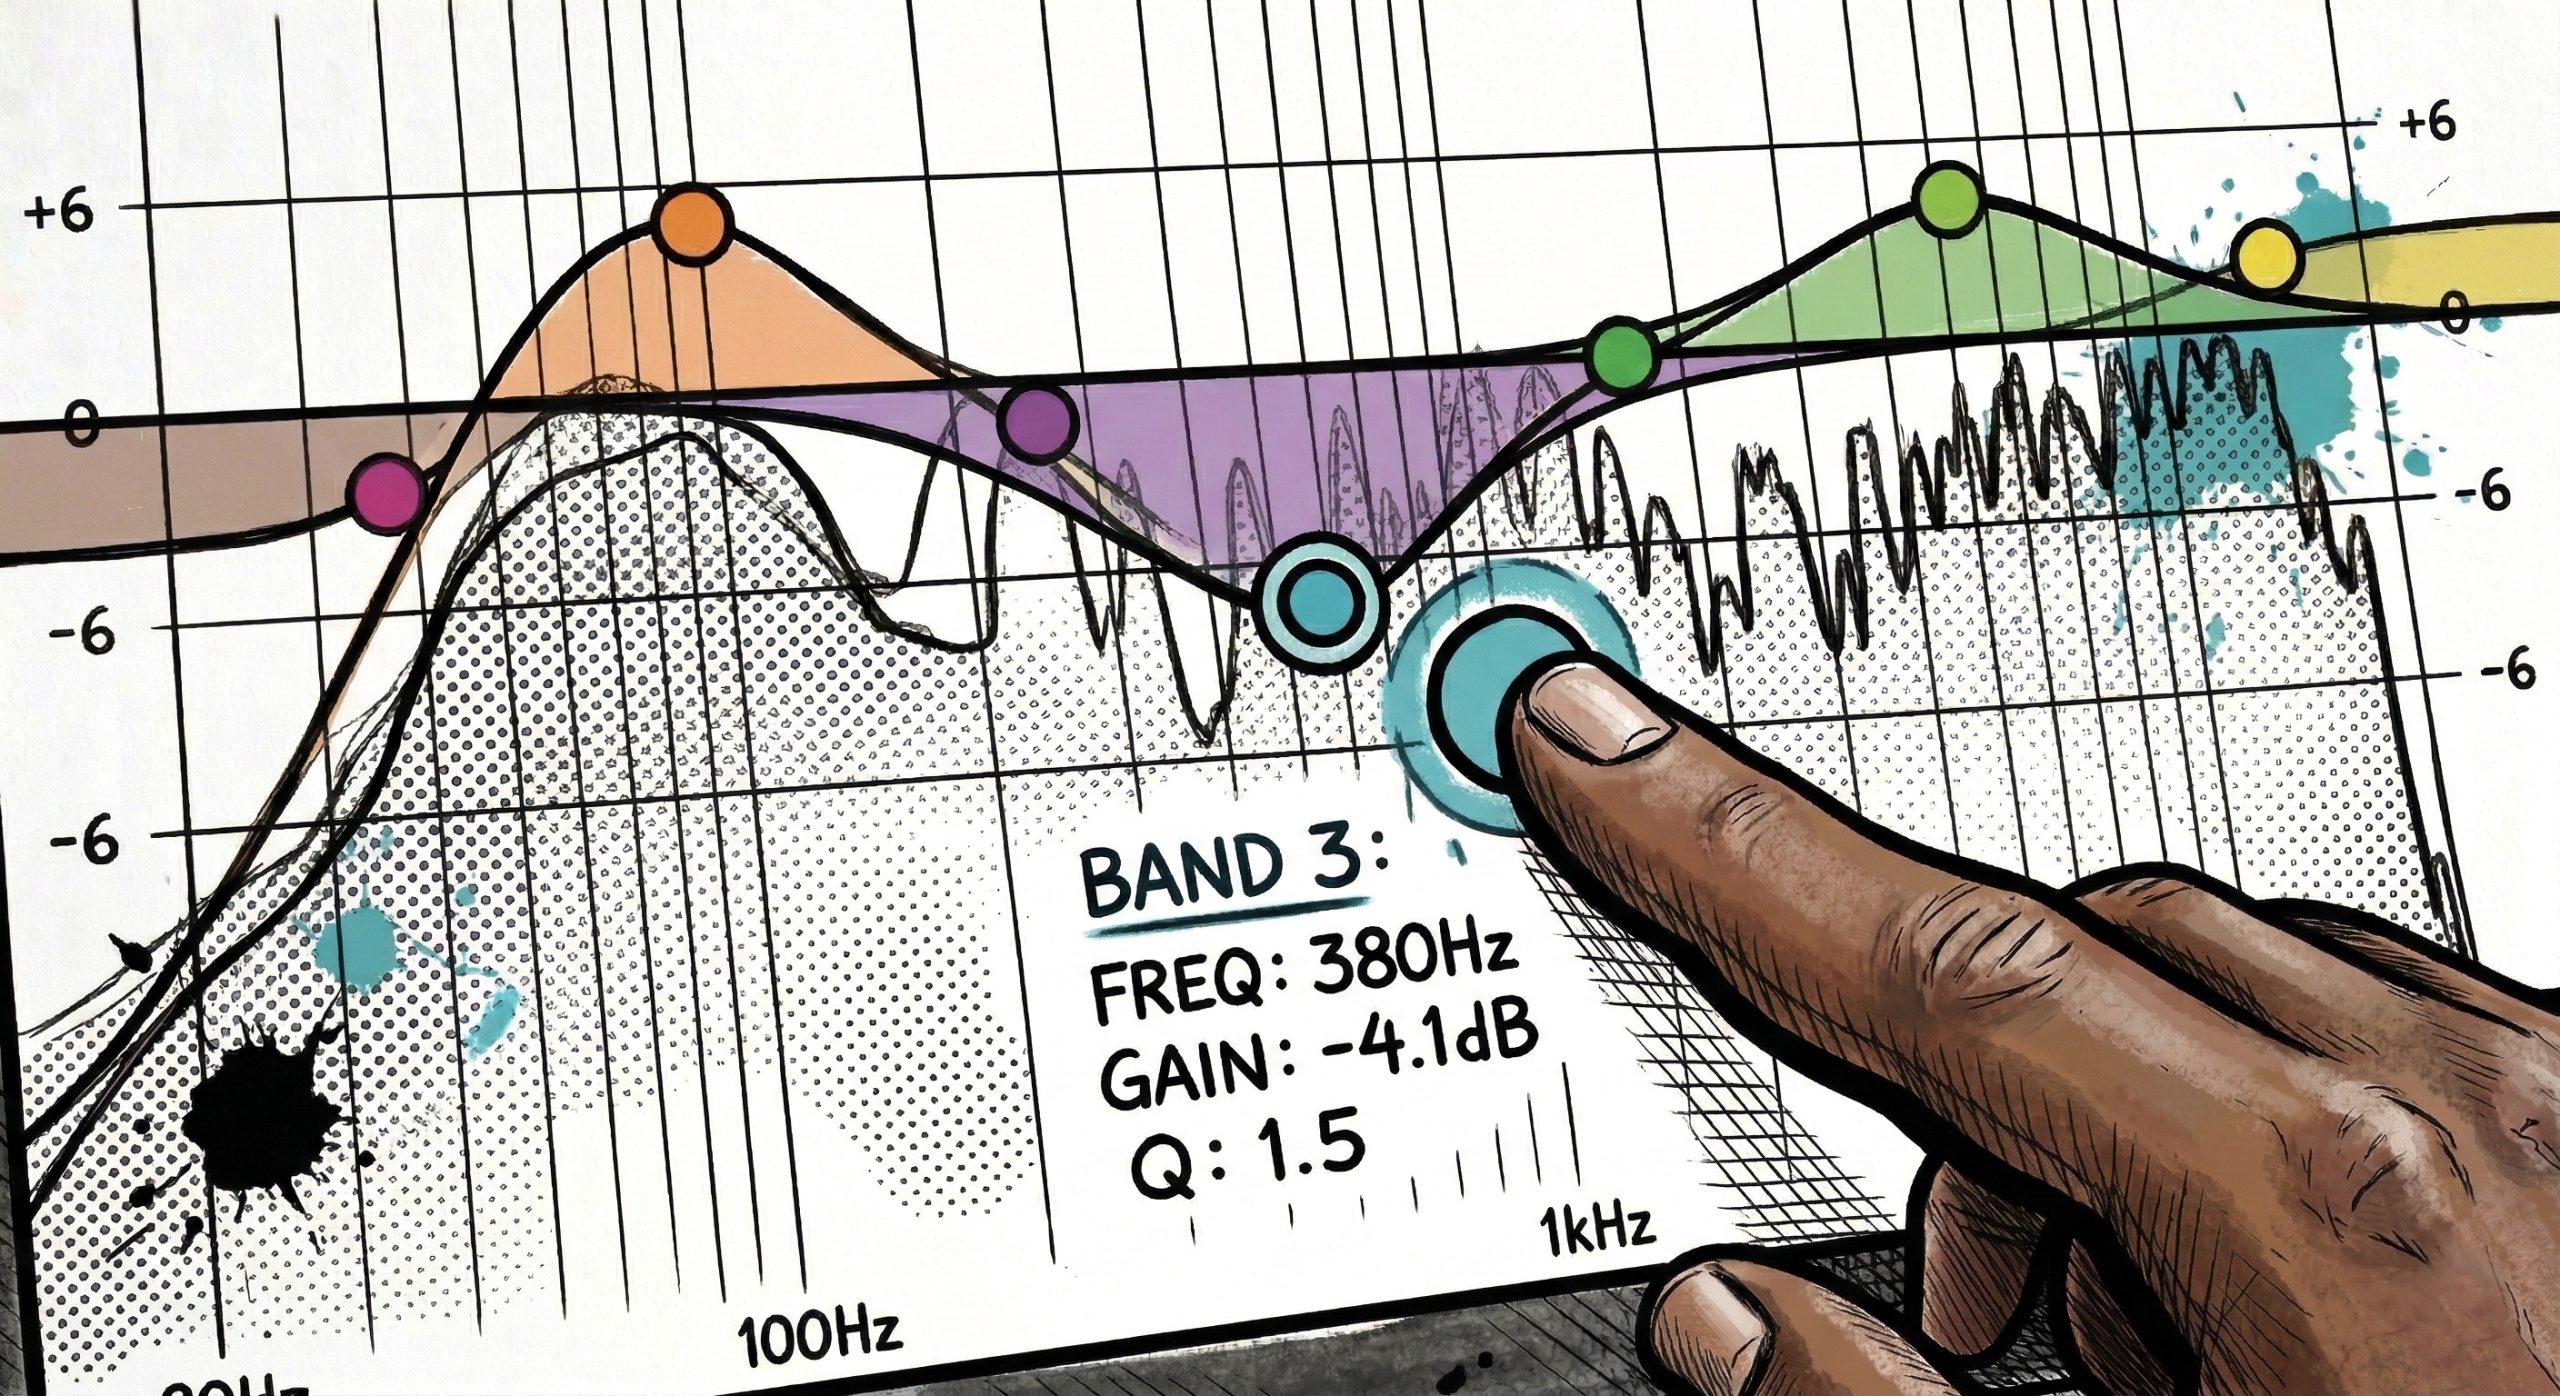
- You will see a graph. The left side represents low, bassy frequencies. The right side (from roughly 1kHz to 5kHz and above) represents the high, piercing frequencies.
- The yellow bouncing bars jumping up and down behind the graph are the RTA (Real-Time Analyzer). If you hear a loud ring, look for the yellow bar that is spiking aggressively—that is your feedback!
How to Kill the Ring On the screen, you will see colored circles representing available frequency bands.

- Touch the colored circle closest to where the yellow RTA bar is spiking.
- Pull that circle down to lower (or “cut”) that exact frequency.
- Golden Rule: Use narrow cuts to kill feedback so you don’t accidentally hollow out the natural warmth of the singer’s voice!